
Sunday July 14, 2024 VOLUME 8 ISSUE 26
AAPL | AMZN | BTC | DOW | CL | ES | GC | GOOGL | META | MSFT | NVDA | TSLA | US
Introduction
For your subscription you get SSS weekly AND access to the BONUS charts! All New Format now! Better organized, grouped by sections and topics. Sunny Side of the Street is now easier to read, with fewer ads. Here's the Front Matter, Announcements, Specials, Upcoming Events etc. Below that we have the SSS Analysis. Please SUBSCRIBE now.
IMPORTANT NOTES and NEWS:
- FREE LUNCHEON with Sunny Los Angeles (near LAX) and Cocktail Hour/Mixer at 7pm. PLUS EasyLanguage, War Stories and Testing Methods Mini-Conference. Sept. 22, 2024. No more registrations after July 31, 2024 5pm PT. Register NOW.
- Happy Half Hour on Sunday August 4th at 1:15pm PT. Register Here to get the link. Join in the fun for Free.
- Tune In to "Trade Along with Sunny" Wednesdays at 9:00am PT. Or better yet: How about Every Day?
- Wanna see a quick replay of a TAWS ("Trade Along With Sunny") Live Trading Session? Click here and see how Sunny trades in TAWS every morning.
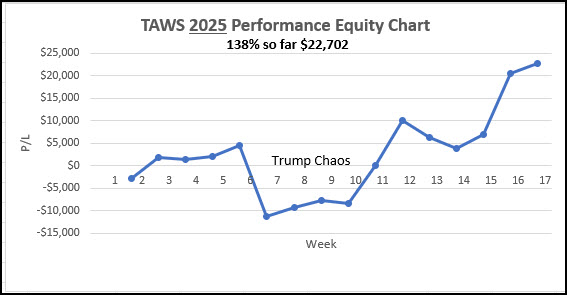
- Look below to see a running tally of how we are doing in Daily TAWS: UP 211% in 25 weeks! It's time for YOU to Join In!
- Notice the picture in the upper right corner is now a Bull. At lease the Dow thinks it is.
- NB: the CME has increased the IntraDay margin for the ES, to $1,364 from $1,298 and the OverNight margin to $13,640. Keep this in mind as you decide how many contracts to trade.
Trade Along with Sunny (TAWS) DAILY
NOTICE: For ALL TAWS Daily Subscribers: FREE Lunch with Sunny Harris. In Los Angeles, September 21, 2024. Subscribe HERE to be included for Free. Without the Daily Subscription the Time and Luncheon will be $95.
The Mini-Conference on Day 2 is $995 for 4 hours of EasyLanguage intensive instruction AND Proper testing & optimization methods. Just $695 for Daily TAWS Subscribers.
$95 Luncheon for Non-Subscribers
Join in Daily as Sunny shares her screen and her trading maneuvers. Listen to her say what she's looking for, call out the trades, take the trades, and explain why. Subscribe NOW. Sunny wants you to get good at this! Look what we've done in 25 weeks since inception! 211%! Even with the short-term drawdowns.
Currently Available Bundle Discounts
None at this time. Call for SPECIAL Pricing: 1-760-908-3070.
7-Day Free Trial
Most make enough during the Free Trial to cover the cost of SunnyBands. Trade for free during the Free Trial. TWO Zoom meetings with Sunny in that first week. Learn to trade like Sunny. See Quips & Quotes to find out what my clients say. I can only do 20 trials a month, so sign up now.
Podcast
Meet and get to know the Legends in this industry! Listen in as they talk about their beginnings and their travails as they learned to trade. 48 Podcasts so far! Latest podcast posted this weekend: Robert Miner! Dynamic Trader, Gann-Elliott & Fibonaccii Price and Time Expert!

Sunny Side of the Street (SSS)
The charts below are now organized first alphabetically by commodities and then alphabetically by stock symbol. It should be easier to read and find the symbol you want to take a look at.
| DOW: | BTC: | TSLA: |
 |
 |
 |
| AAPL: | META: | GOOGL: |
 |
 |
 |
VantagePoint Prediction
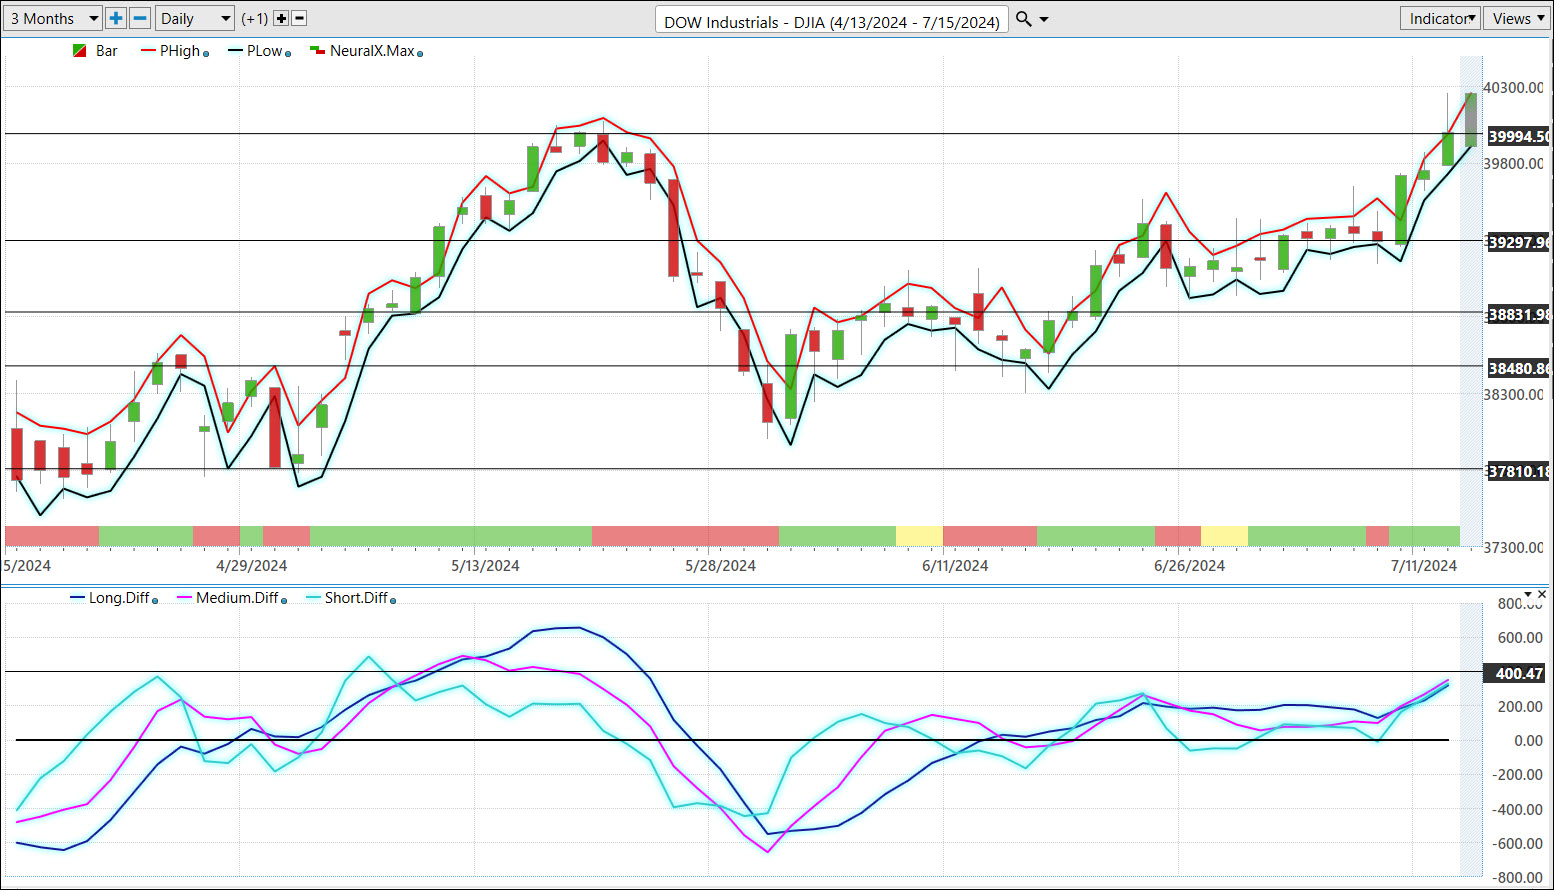
This prediction is for Monday to be lower than Friday's high and to stay above Friday's low, though not by much What it doesn't tell us is the Close. Will we go higher and then close lower? Or will be start low and go up higher?
The predicted high is 40,258 while the predicted low is 39,912. That gives us a range of about 345 points for Monday . I mark the High and Low on my chart with Horizontal Lines and watch the day's progress with respect to the VP predictions. I'll even show you in TAWS; just remind me.
The moving averages are sloping upward together, all 3 coincident. Definitely looks positive.
Tune in to Trade Along With Sunny (TAWS) on Wednesday mornings at 9amPT each week to see how I use it and my proprietary indicators to trade live. Put in your FIRST and LAST names. All newcomers welcome! You are welcome to 2 Guest Passes before you subscribe.
The VP moving averages are all above the zero-line and climbing.
Take a look at the Monthly chart below for more long-term insight.
Overview (DOW & ES)
Chart

Statistics
Created : 07/13/2024 03:19pmSymbol "$INDU", Bar Type = Daily
Last Close = +40,000.90 : the close Friday was at +40,000.90.
Change from last Sunday (+/-) (+39,375.87) = +625.03
Purple or Gold on top? Gold
UOB = +40,067.71
UIB = +39,798.90
MidLine = +39,349.32
MidAngle = 89.30
Slope = 88.95
LIB = +38,899.75
LOB = +38,630.94
Above/Below 21-day MAV = 39194.22 - Above
Above/Below 50-day MAV = 39106.31 - Above
Above/Below 200-day MAV = 37424.15 - Above
Color of DMA_H = Gold
All Time High = +40,257.24 Percent = -0.64% on 07/12/2024 0 bars ago.
$INDU was up by 625.03 this week and now is sitting at +40,000.90.
Last Time I Said
"The signal is still for Cash at the moment. We need more information before choosing a side. As long as it's sideways, we do nothing." On Wednesday we got a solid Buy signal and continued on up for the remainder of the week.
Current SunnyBands Signals
We were up by +625.03 this week. Now it's back to normal. The current signal is Long from 07/02/24 at 39,331.85. With price currently at 40,000.90 that's a potential of 669.05 points profit so far...
Analysis
- Current Price: 40000.90
- SunnyBands: widening with the UOB at 40067.71
- Who'sOnTop: Gold
- DMA_H: Turned Goldenrod and moving upward, getting longer.
- Slope: 88.95 degrees
This week we were up by -+625.03 in an exciting week as we had a high of 40,257, closing Friday at 40,000.90. If past events hold we will likely encounter profit taking at the top. On the Weekly, the DMA_H is moving down toward the zero-line which could foretell that movement. But on the Daily it is Gold and getting longer. With these mxed signals it's difficult to tell which way we will go.
For Reports, this week we have Mfgr Survey, Fed speaks, Retail sales, Import prices, Biz inventories, Fed speaks; Housing starts, Building Permits, Industl production, Capacity utilizatiio; Fed Beige Book, Leading economic indicators; more Fed speaks.n/p>
Here's the LINK to my source of data. The next big Fed Speak is July 30 - 31. Again, it's all fear and greed, so it could go either way. Here's a link to this week's critical reports.
I think we could see a further rise in the Dow this week. There is an Attractor overhead at 41,000 that could be reached.
Now it's 31 bars since the ATH We are currently below 40,000, and I think we should see some congestion for a few more days.
The next Fib level on the Monthly chart lies overhead at 41,340 and I do think we will get there, but it's going to take more time. BUT, be careful in here; it could easily go down. Ask me to show my chart to you in TAWS-Daily this week. It's important.
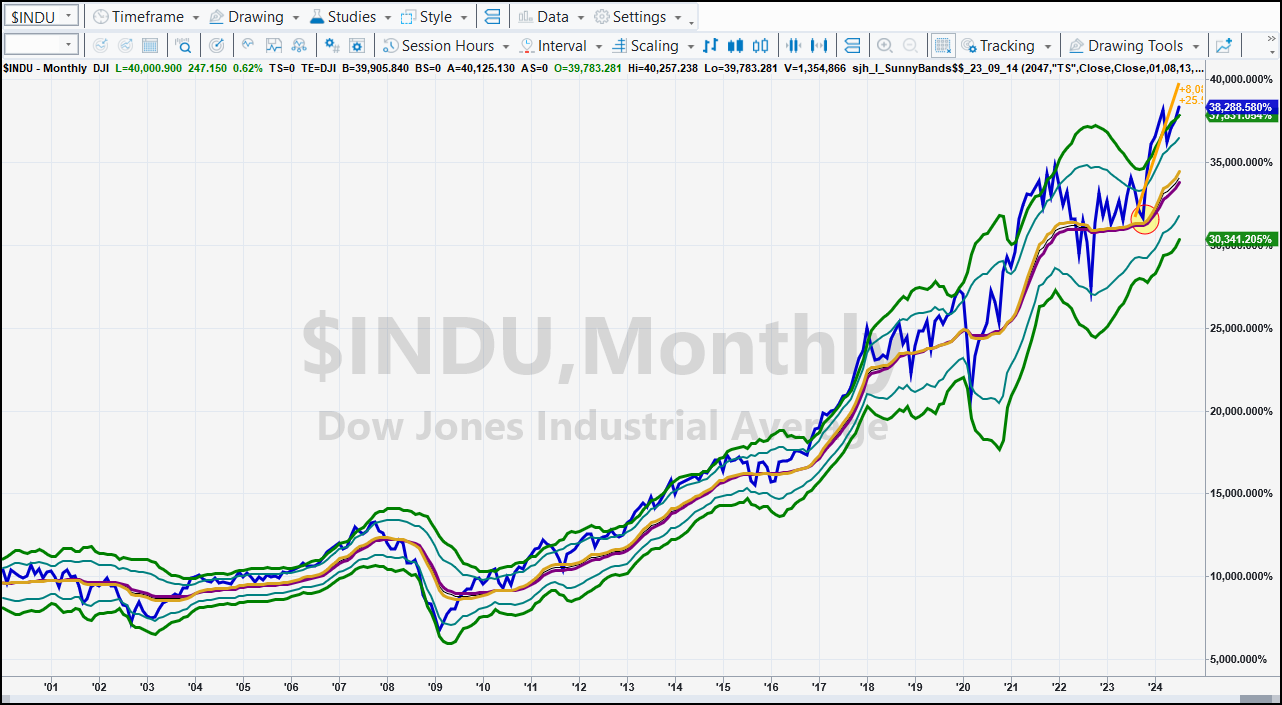
The Blue line on the Monthly is now above the UOB and climbing. The fact that the Orange trendline is still above the Blue says to me that there is further room on the upside.
Chart

Statistics
Created : 07/12/2024 06:02pmSymbol "@ES", Bar Type = Daily
Last Close = +5,664.75 : the close Friday was at +5,664.75.
Change from last Sunday (+/-) (+5,621.50) = +43.25
Purple or Gold on top? Gold
UOB = +5,697.00
UIB = +5,656.80
MidLine = +5,590.10
MidAngle = 81.90
Slope = 77.95
LIB = +5,523.41
LOB = +5,483.21
Above/Below 21-day MAV = 5567.18 - Above
Above/Below 50-day MAV = 5438.07 - Above
Above/Below 200-day MAV = 5058.88 - Above
Color of DMA_H = Red
All Time High = +5,708.25 Percent = -0.76% on 07/12/2024 0 bars ago.
@ES was up by 43.25 this week and now is sitting at +5,664.75.
Last Time I Said
"On Wednesday we got a Long Signal as Price closed at the UIB from 5568.75. Price in the after-hours is down 7 points to 5614. That would right now be 45.25 per point. I'm holding in for a week of important reports and the opening of the next Earnings Season. Expect volatility." Holding was the right thing to do as ES made a new ATH this week, but did not close on the high.
Current SunnyBands Signals
A week ago Wednesday we got a Long Signal as Price closed at the UIB from 5568.75. Price is now at 5,667 for a potential 98.75 points of profit.
Analysis
- Current Price: 5664.75
- SunnyBands: widening with the UOB at 5697.00
- Who'sOnTop: Gold
- DMA_H: Turned Red and heading down, but will need some time.
- Slope: 77.95 degrees
While price is up this week, and even made a new ATH, it did not close on that high. Gold is still on top (DMA) and Slope is highly positive. Yet, we have Red lines on the DMA_Histogram, getting shorter. I'm expecting ES to correct back to the DMA at 5,590 before continuing its climb upwards.
On the Natural Numbers chart we are nmoving back toward the 5,600 level, having pierced the 5,700 level. Once that's resolved I expect further motion to the upside.
Commodities
Chart

Statistics
Created : 07/12/2024 04:31pmSymbol "@BTC", Bar Type = Daily
Last Close = +57,845 : the close Friday was at +57,845.
Change from last Sunday (+/-) (+56,685) = +1,160
Purple or Gold on top? Purple
UOB = +68,826
UIB = +66,287
MidLine = +62,036
MidAngle = -89.82
Slope = -89.74
LIB = +57,784
LOB = +55,245
Above/Below 21-day MAV = 61938.81 - Below
Above/Below 50-day MAV = 65087.40 - Below
Above/Below 200-day MAV = 54517.53 - Above
Color of DMA_H = Green
All Time High = +76,880 Percent = -24.76% on 03/14/2024 82 bars ago.
@BTC was up by 1160 this week and now is sitting at +57,845.
Last Time I Said
"It looks like it should drop back down to the LOB at 59,286." This week it did just that. And lower!
Current SunnyBands Signals
We are still in a Sell signal, from 69,755 on 06/07/24. With price now at 57,805 that's about 11,950 points of potential profit.
It looks like it should drop back down to the 200-day MAV at 52,693.
ARE YOU taking these signals? Are you making this potential profit? If not, why not?! At the very least join my Live Trading Room: Daily at 9:00am PT.
Analysis
- Current Price: 57845
- SunnyBands: closing with the UOB at 68826
- Who'sOnTop: Purple
- DMA_H: Turned DarkGreen and heading up, but will need some time.
- Slope: -89.74 degrees
On the Monthly chart Price is heading toward the Flat DMA (51,924) with Gold on top but the DMA_H is Red and moving down.
Further, Price is below the 21-Week MAV which doesn't bode well.
Back to the Daily chart. Price is below the 21- and 55-day MAVs and only above the 200-.
We are holding on to the Short trade with 11,950 points of potential profit in it.
Crude Oil (CL)
Chart
Statistics
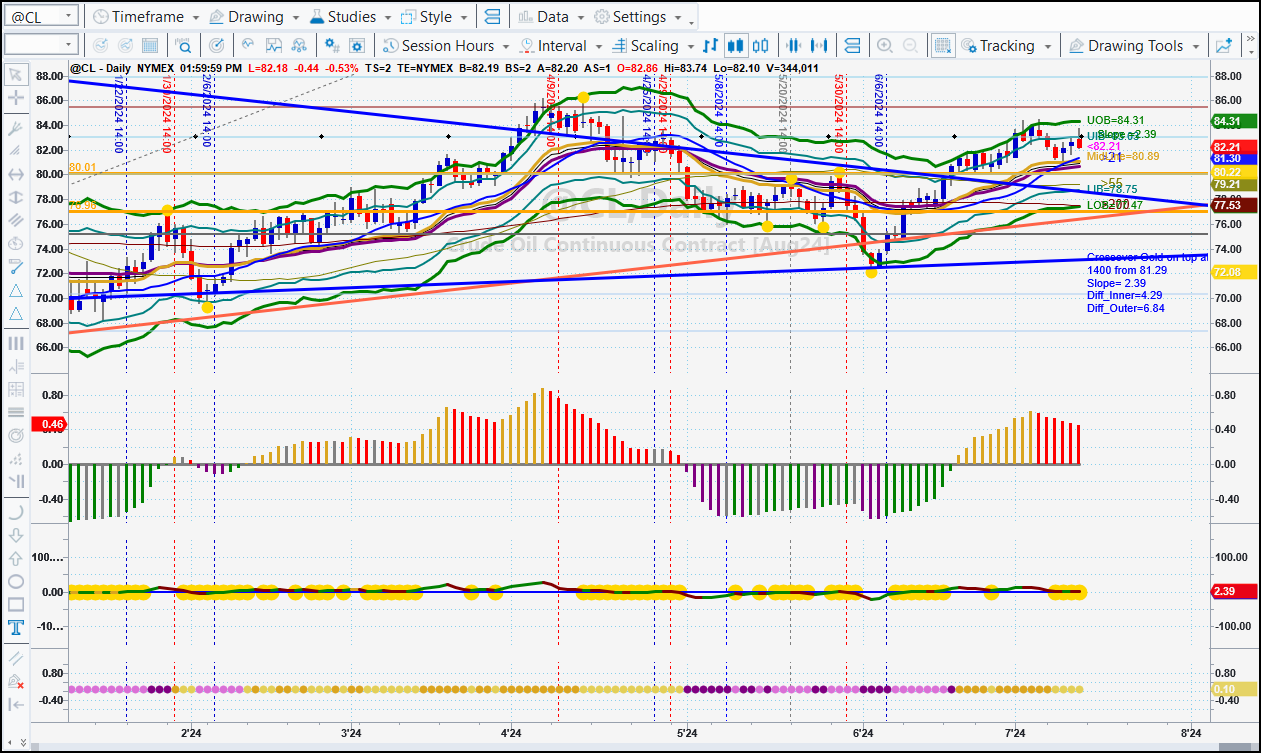
Created : 07/12/2024 05:44pmSymbol "@CL", Bar Type = Daily
Last Close = +82.21 : the close Friday was at +82.21.
Change from last Sunday (+/-) (+83.16) = -0.95
Purple or Gold on top? Gold
UOB = +84.31
UIB = +83.03
MidLine = +80.89
MidAngle = 3.58
Slope = 2.39
LIB = +78.75
LOB = +77.47
Above/Below 21-day MAV = 81.30 - Above
Above/Below 50-day MAV = 78.92 - Above
Above/Below 200-day MAV = 77.53 - Above
Color of DMA_H = Red
All Time High = +203.76 Percent = -59.65% on 07/11/2008 4032 bars ago.
@CL was down by -0.95 this week and now is sitting at +82.21.
Last Time I Said
"Crude is tricky in here, until we break above the Flat DMA with Purple on top, or break below the LOB, which is right where it closed on Friday." And this week it dipped to the DMA and bounced back to the UIB.
Current SunnyBands Signals
On 06/06/24 we got a confirmed SunnyBands Buy signal at 75.15. With price now at 82.55 we have a potential profit of 7.06 points. At a BPV of $1,000 that's even better!
Analysis
- Current Price: 82.21
- SunnyBands: parallel with the UOB at 84.31
- Who'sOnTop: Gold
- DMA_H: Turned Red and heading down, but will need some time to get there.
- Slope: 2.39 degrees
The price of gasoline in my neighborhood is now flat again at $4.99./gal, even though the price of Crude is rising. (Two weeks ago it was $5.39) I saw one pump with price in $/litre. That'll make us think it's cheaper. Make the package smaller. Mark (in my Daily TAWS meeting) told me that 1 gallon is 3.7854 Litres. Good to know!
The DMA is Flat at 2.38 degrees (Slope). Red bars are presented on the DMA_H. Price is > all 3 MAVs. I'm expecting it will dip lower for a day or two and then bounce off the DMA again. Contrary to that, the two moves up resulted in Lower Highs. That's a warning. We could easily get into congestion at the DMA.
On the Weekly chart I see that we have been right at the Flat DMA for the last 6 weeks or so rising slightly above it and then reverting back to it.
Chart
Statistics
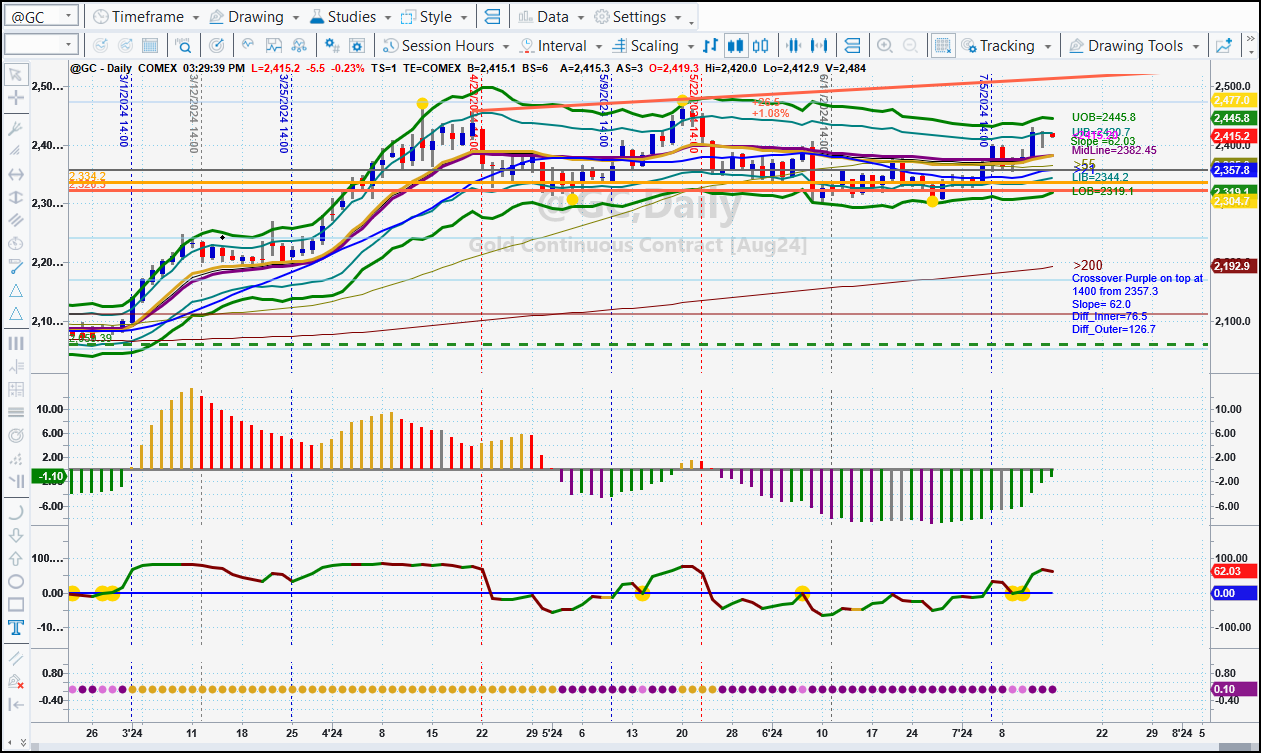
Created : 07/12/2024 06:03pmSymbol "@GC", Bar Type = Daily
Last Close = +2,420.7 : the close Friday was at +2,420.7.
Change from last Sunday (+/-) (+2,397.7) = +23.0
Purple or Gold on top? Purple
UOB = +2,446.8
UIB = +2,420.6
MidLine = +2,380.1
MidAngle = 74.58
Slope = 67.52
LIB = +2,339.7
LOB = +2,313.5
Above/Below 21-day MAV = 2354.90 - Above
Above/Below 50-day MAV = 2364.65 - Above
Above/Below 200-day MAV = 2190.88 - Above
Color of DMA_H = Green
All Time High = +2,477.0 Percent = -2.27% on 05/20/2024 36 bars ago.
@GC was up by 23.0 this week and now is sitting at +2,420.7.
Last Time I Said
>"We were in a SunnyBands Sell signal from 05/22/24 at 2415.7. At the Gray Vertical Line on 06//11/24 at 2326.6 we closed the Short for 89 points potential profit. At $100 per full point, that's a potential $8,910 profits in a month." As of this week we are in a new SunnyBands Buy signal from 07/06/24 at 2,397.70.
Current SunnyBands Signals
We are now in a Buy signal from Friday last week, 07/05/24, at 2,397. With price at 2,411.0 in the after-hours that's about 13 points of potential profit. With a BPV of 100 that's $1,300 in a week.
Analysis
- Current Price: 2420.7
- SunnyBands: narrowing slightly with the UOB at 2446.8
- Who'sOnTop: Purple
- DMA_H: Turned DarkGreen and heading up, about to cross the zero-line.
- Slope: 67.52 degrees
I'm still looking for Gold at 2,500. With an ATH at 2,448 we don't have far to go. Price is above all 3 MAVs with the DMA_H near to crossing the zero-line. Slope is positive, but Red, so it's slowing down. With Purple on top we could easily drop to the DMA at 2,382.15 before resuming a march upward.
Gold is back above 2,400. I stand by the hope of 2,500.
Price is above all 3 MAVs and I think that this week we will touch the UOB, which is currently at 2,446.
Chart

Statistics
Created : 07/12/2024 06:04pmSymbol "@US", Bar Type = Daily
Last Close = +119.93750 : the close Friday was at +119.93750.
Change from last Sunday (+/-) (+118.81250) = +1.12500
Purple or Gold on top? Gold
UOB = +120.75940
UIB = +119.76496
MidLine = +118.20971
MidAngle = 5.00
Slope = 3.34
LIB = +116.65446
LOB = +115.66002
Above/Below 21-day MAV = 119.07 - Above
Above/Below 50-day MAV = 117.82 - Above
Above/Below 200-day MAV = 117.63 - Above
Color of DMA_H = Gold
All Time High = +185.31250 Percent = -35.28% on 03/09/2020 1094 bars ago.
@US was up by 1^04 this week and now is sitting at +119.93750.
Last Time I Said
"You would think that means interest rates are going down. Since they aren't yet, I'm thinking this means that the market is already pricing in a rate cut in the fall." And with US moving up that should mean that interest rates are going down.
Current SunnyBands Signals
We are in a Buy signal from 07/05/24 at 118^26. Price is currently at 119^30 in the after-hours. That's a potential profit of 1^04 points.
- Current Price: 119^30
- SunnyBands: closing with the UOB at 120^24
- Who'sOnTop: Gold
- DMA_H: Turned Goldenrod and heading down, but looks like it wants to go back up.
- Slope: 3.34 degrees
When US goes down, the expectation is for Interest Rates to go up. This week and last price has been going upward as it bounced off the DMA on 06/11/24 and kept on climbing. You would think that means interest rates are going down. Since they aren't yet, I'm thinking this means that the market is already pricing in a rate cut in the fall. If it doesn't happen we will be in for a shock in the market.
Looking at the Weekly chart tells me that Price is moving solidly sideways. Right at the Flat DMA. Gold is on top, but Flat.
Stocks
AAPL
Chart

Statistics
Created : 07/12/2024 06:13pmSymbol "AAPL", Bar Type = Daily
Last Close = +230.54 : the close Friday was at +230.54.
Change from last Sunday (+/-) (+226.34) = +4.20
Purple or Gold on top? Gold
UOB = +231.38
UIB = +227.47
MidLine = +221.14
MidAngle = 42.07
Slope = 31.03
LIB = +214.82
LOB = +210.91
Above/Below 21-day MAV = 217.89 - Above
Above/Below 50-day MAV = 201.00 - Above
Above/Below 200-day MAV = 185.95 - Above
Color of DMA_H = Red
All Time High = +233.08 Percent = -1.09% on 07/10/2024 2 bars ago.
AAPL was up by 4.20 this week and now is sitting at +230.54.
Last Time I Said
"I expect it will hit the Flat DMA at 205 and bounce." That happened over 2 weeks ago and price has continued on up to its current 230.43.
Current SunnyBands Signals
SunnyBands rules have me in a Buy signal on 06/26/24 at 213.25. Price is currently at 230.43 so that's about 17 points of potential profit in about 2 weeks.
Analysis
- Current Price: 230.54
- SunnyBands: closing with the UOB at 231.38
- Who'sOnTop: Gold
- DMA_H: Turned Red and heading down, but will need some time.
- Slope: 31.03 degrees
AAPL is above all 3 MAVs and the 21-day MAV is below the DMA, adding a goal IF it moves downward.
Slope is positive at 31 degrees but has turned Red, indicating the rise has slowed. Compounding that, on the DMA_H we have Red bars getting shorter. This could hint at a downturn being in order. There is an Attractor below at 220 which just happens to be right at the DMA. It beckons, but will it happpen?
On the Weekly it looks like it is just going upward. With it at a new ATH it could enter profit-taking OR it could fly on up with no bounds.
AMZN
Chart

Statistics
Created : 07/13/2024 01:36pmSymbol "AMZN", Bar Type = Daily
Last Close = +194.49 : the close Friday was at +194.49.
Change from last Sunday (+/-) (+200.00) = -5.51
Purple or Gold on top? Gold
UOB = +200.21
UIB = +197.24
MidLine = +192.30
MidAngle = 2.43
Slope = 1.62
LIB = +187.35
LOB = +184.38
Above/Below 21-day MAV = 192.18 - Above
Above/Below 50-day MAV = 187.40 - Above
Above/Below 200-day MAV = 164.37 - Above
Color of DMA_H = Red
All Time High = +201.20 Percent = -3.33% on 07/08/2024 4 bars ago.
AMZN was down by -5.51 this week and now is sitting at +194.49.
Last Time I Said
"Price is above all 3 MAVs but is in a painfully sideways channel on the Weekly AND the Daily charts. There is an Attractor at 188.35 that is holding down further price movement upward." The first part of the week continued sideways and then it dropped to the DMA on Thursday.
Current SunnyBands Signals
The most recent SunnyBands signal was Long from 06/04/24 at 179.34. Right now we are in Cash from the Gray Vertical Line on Thursday at 195.05 for a potential 15.71 points profit. As it passed down through the UIB, I elected to close the position.
Analysis
- Current Price: 194.49
- SunnyBands: closing with the UOB at 200.21
- Who'sOnTop: Gold
- DMA_H: Turned Red and heading down, but will need some time.
- Slope: 1.62 degrees
We are in a Cash position at the moment for the retracement to clear. With Gold on top I expect it to go about to that level, possibly then meander around humming before they sing the real tune.
Price is above all 3 MAVs but is now retracing from the ATH 4 days ago. It's standard. That's part of why I want to be in Cash at this juncture. The DMA is Flat at -1.62 degrees.
On the DMA_H it's Gold on top but has Red bars moving downward. They have a way to go before crossing the zero-line, however.
GOOGL
Chart

Statistics
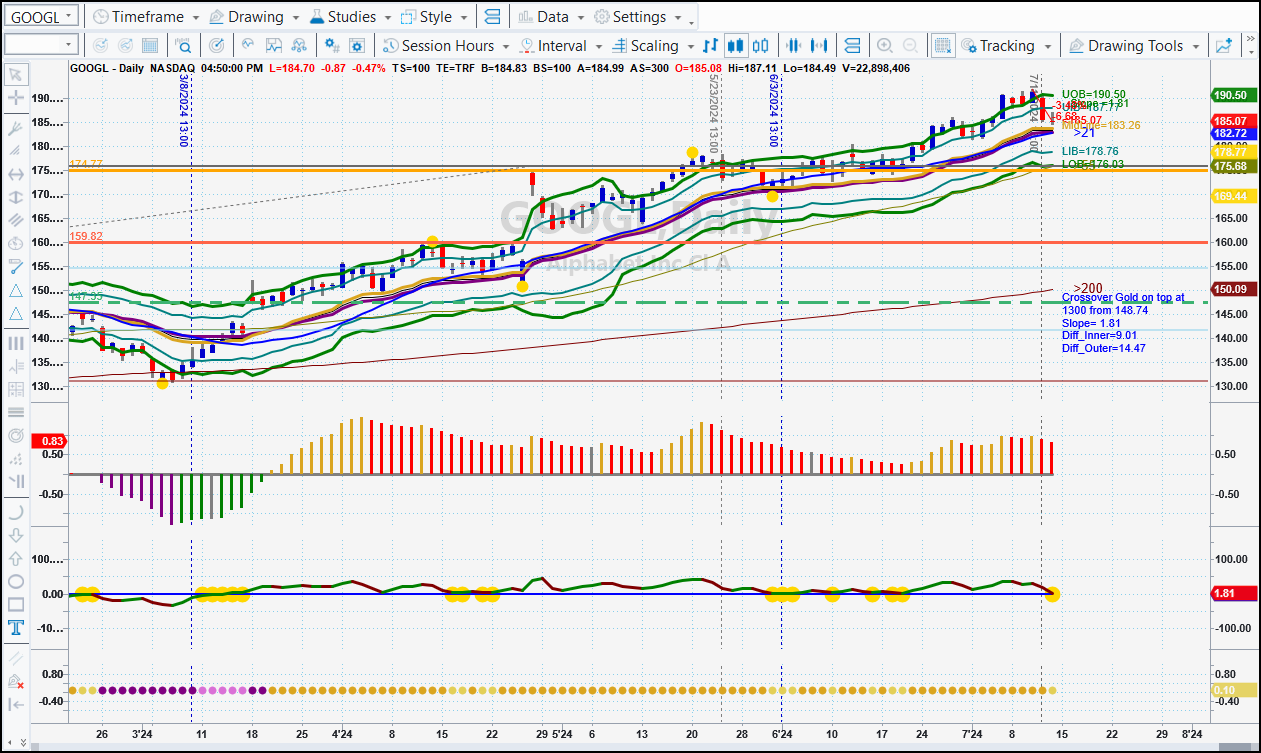
Created : 07/13/2024 01:37pmSymbol "GOOGL", Bar Type = Daily
Last Close = +185.07 : the close Friday was at +185.07.
Change from last Sunday (+/-) (+190.60) = -5.53
Purple or Gold on top? Gold
UOB = +190.50
UIB = +187.77
MidLine = +183.26
MidAngle = 2.72
Slope = 1.81
LIB = +178.76
LOB = +176.03
Above/Below 21-day MAV = 182.72 - Above
Above/Below 50-day MAV = 176.93 - Above
Above/Below 200-day MAV = 150.09 - Above
Color of DMA_H = Red
All Time High = +191.75 Percent = -3.48% on 07/10/2024 2 bars ago.
GOOGL was down by -5.53 this week and now is sitting at +185.07.
Last Time I Said
I should have remembered how often markets go down right after making a new ATH.
Current SunnyBands Signals
We are in a Cash signal now. I liquidated my holdings in GOOGL on Thursday for a nice profit. The SunnyBands rules also have us in Cash now from Thursday's close. I am now waiting for a bounce from the Flat DMA. If we get proof I'll go Long again.
Analysis
- Current Price: 185.07
- SunnyBands: closing with the UOB at 190.50
- Who'sOnTop: Gold
- DMA_H: Turned Red and heading down, but will need some time to get below the zero-line.
- Slope: 1.81 degrees
GOOGL made another new ATH this week on Wednesday, at 191.75! It definitely ourran the projection! The Daily, Weekly & Monthly all look like it's just onward and upward from here. But first, the pause for the profit takers. It may creep along sideways for a bit first.
The next Earnings Report for Alphabet is July 23, 2024.
Let's take a look at the Monthly. (Bring it up on your computer.) On this one price is above all 3 MAVs and Slope is positive at +77 degrees. To get an idea where up is from a high we need to pull Fib Extensions. Doing that tells me that the next level, at 23.6%) is at 196.77. Currently price is at 185.07. That's a bit of a jump for GOOGL, if it happens. Of course, the recent ATH could lead to profit taking at this level. Beware!
Full disclosure: I took profits on my holdings in GOOGL last week. I'm looking for a bit of a retracement or a move higher than the Fib line before buying back in.
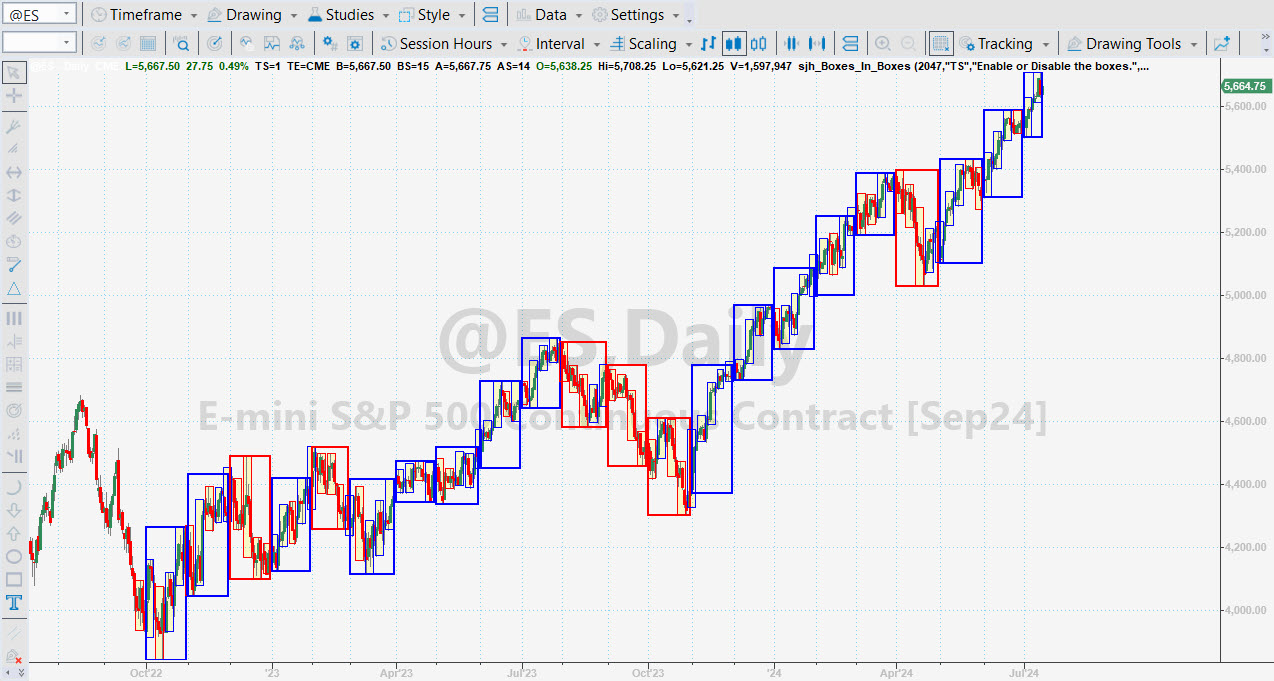
Here's a chart for you! This is my NEW "Boxes in Boxes" indicator. With this I can see Daily, Weekly & Monthly all on one chart. It works IntraDay as well.
Chart

Statistics
Created : 07/13/2024 01:39pmSymbol "META", Bar Type = Daily
Last Close = +498.87 : the close Friday was at +498.87.
Change from last Sunday (+/-) (+539.91) = -41.04
Purple or Gold on top? Gold
UOB = +542.06
UIB = +529.42
MidLine = +508.88
MidAngle = -11.45
Slope = -7.69
LIB = +488.34
LOB = +475.70
Above/Below 21-day MAV = 511.23 - Below
Above/Below 50-day MAV = 489.46 - Above
Above/Below 200-day MAV = 421.11 - Above
Color of DMA_H = Red
All Time High = +542.81 Percent = -8.09% on 07/08/2024 4 bars ago.
META was down by -41.04 this week and now is sitting at +498.87.
Last Time I Said
"We are now still Flat META, but we got up to the UOB this week. BUT, as soon as it got there it turned around on Friday, passed through the UIB and headed for the DMA." We are down past the DMA after the ATH, in the expected profit taking.
Current SunnyBands Signals
I am still Flat META, with price below the Flat DMA. It's too soon to go Short and too soon to go Long.
Do you have SunnyBands? How about a Free 7-day Trial?
Analysis
- Current Price: 498.87
- SunnyBands: closing with the UOB at 542.06
- Who'sOnTop: Gold
- DMA_H: Turned Red and heading flat, but will need some time.
- Slope: -7.69 degrees
META went mostly down this week, and then below the DMA. I expect it will do one of two things: either drop to the LIB at 488.34 or bounce off the DMA after some choppy action.
--> NVDA
Chart

Symbol "NVDA", Bar Type = Daily
Last Close = +129.24 : the close Friday was at +129.24.
Change from last Sunday (+/-) (+125.83) = +3.41
Purple or Gold on top? Gold
UOB = +137.23
UIB = +133.02
MidLine = +126.41
MidAngle = 2.86
Slope = 1.91
LIB = +119.79
LOB = +115.58
Above/Below 21-day MAV = 127.66 - Above
Above/Below 50-day MAV = 112.73 - Above
Above/Below 200-day MAV = 75.17 - Above
Color of DMA_H = Red
All Time High = +140.76 Percent = -8.18% on 06/20/2024 15 bars ago.
NVDA was up by 3.41 this week and now is sitting at +129.24.
Last Time I Said
"We are Flat NVDA now. It dipped below the Flat DMA where it is still holding. Price will go down, and on the SunnyBands signal I'll be a buyer again. Or, it will go up in a show of strength and I'll be a buyer again." And this week NVDA is still in a holding pattern, neither bouncing off the DMA or dropping beneath it.
Current SunnyBands Signals
We are Flat NVDA now. It dipped below the Flat DMA where it is still holding. Price will go down, and on the SunnyBands signal I'll be a buyer again. Or, it will go up in a show of strength and I'll be a buyer again.
Analysis
- Current Price: 129.24
- SunnyBands: closing with the UOB at 137.23
- Who'sOnTop: Gold
- DMA_H: Turned Red and heading down, but it looks very close to crossing.
- Slope: 1.91 degrees
There was a gappy down move 2 weeks ago taking price beneath the DMA (Flat with Gold on top) and nearly to the LIB. There is an Attractor at 125.57, is acting as support now.
The anticipated move down didn't materialize, or at least did not go farther than the DMA. In fact, right now we are above the DMA slightly, but the direction still looks sideways.
Price is above all 3 MAVs but Slope is Flat at 1.91 degrees. Gold is on top but Flat aand the DMA_H is showing Red bars making progress to the zero-line. This makes me suspect more of a down move cooming.
TSLA
Chart
Statistics
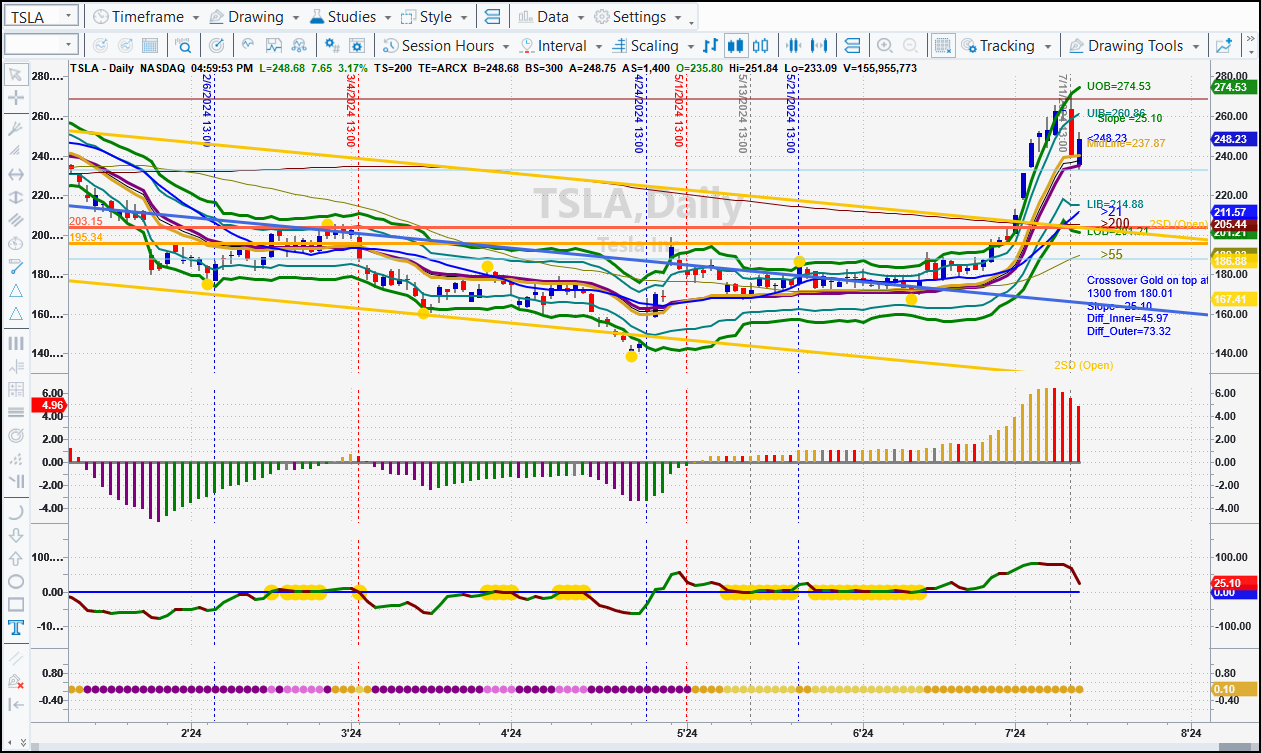
Created : 07/13/2024 01:46pmSymbol "TSLA", Bar Type = Daily
Last Close = +248.23 : the close Friday was at +248.23.
Change from last Sunday (+/-) (+251.52) = -3.29
Purple or Gold on top? Gold
UOB = +274.53
UIB = +260.86
MidLine = +237.87
MidAngle = 35.09
Slope = 25.10
LIB = +214.88
LOB = +201.21
Above/Below 21-day MAV = 211.57 - Above
Above/Below 50-day MAV = 191.36 - Above
Above/Below 200-day MAV = 205.44 - Above
Color of DMA_H = Red
All Time High = +414.50 Percent = -40.11% on 11/04/2021 673 bars ago.
TSLA was down by -3.29 this week and now is sitting at +248.23.
Last Time I Said
"With SunnyBands, we are in a Buy position from 05/21/24 at 186.60. The position is not productive with price currently at 182.85. It's a loss of -4.35 points. So far I'm holding onto it. I believe TSLA will reach up and touch the Attractor at 195."
Not only did it do that, it did us one better: it got up to 203!
Current SunnyBands Signals
With SunnyBands, we are in a Buy position from 05/21/24 at 186.60. I still believe in this stock and the companies it represents. Yes, Musk is weird; he's an Aspie like my grandson. But he definitely is a forward thinker. Read "Elon Musk" by Walter Isaacson for more understanding.
Analysis
- Current Price: 248.23
- SunnyBands: widening with the UOB at 274.53
- Who'sOnTop: Gold
- DMA_H: Turned Red and heading down, but will likely crossover in the near future.
- Slope: 25.10 degrees
TSLA has gathered some steam! In a steady move upward price has touched the Attractor at 203. I expect more from it.
The DMA_H shows Gold on Top and rising. We are very near the Linear Regression Channel top. I'm hoping for a breakout!
The DMA is rising with Gold on top. That's a very bullish sign. Slope is at 52+ degrees and climbing.
On the Weekly the news is less promising. Price is at the tope of the range but pulling slowly back. This looks like an area for some sideways to down action.
I'm still holding the Cash position. There is neither enough of a correction or a show of strength for me to step in.
Thanks for reading my weekly missive.
I would appreciate your insights. EMail Me HERE.
If You Got this Newsletter from someone else and would like to Opt-In, and join us, click here. Help support this effort, please.
Bonus Material
These additional charts are BONUS material for my paid subscribers. Click Here to login with your email address and password.
Products
All subscribers to my Sunny Side of the Street newsletter are eligible for an automatic 10% discount on any of my products. Call if you are interested. 1-760-908-3070 PT OR Click Here and Comment. Be sure to tell me in the Comments that you want SSS.
If you want a yet better price, buy Sunny's indicators by the Bundle. Up to 30% off! This offer is only good until 06/30/24. Don't Miss Out. This offer won't show up again for a long time.
TAWS Daily - Every weekday I open my Live Trading Room ("Trade Along with Sunny") and trade for an hour in the live S&P Futures market, explaining what and why I am taking or exiting a position. It's a great way to learn the power of SunnyBands (and my other indicators) as I use them and explain what I'm doing.
Consulting/Mentoring - There is nothing that makes me happier than my students turning into great and profitable traders. I love to help new traders, and intermediate traders who are in a slump.
Correspondence Course: "Solving the Puzzle." 18 lessons and live sessions with Sunny for each lesson. Learn all you need to get started in trading.
SunnyBands - SunnyBands are a extension of my DMA. The two lines above and two lines below the purple and gold DMA alert me to where the market is going. They are constructed from ATR bands on either side of the DMA. With them I am alerted to Exact Entries and Exits.
DMA_H - Sunny"s DynamicMovingAverage in Histogram format, using sophisticated math to smooth out the whipsaws.
Of course, my indicators work on any symbol, any time frame. In my own trading I use 1-min & 5-min charts of the ES.
Custom Programming - Need help with an idea you want tested with EasyLanguage? I'm the one to do it for you. Fast and inexpensive.
If you aren't already a MoneyMentor Member, please consider joining here. Tell me what you trade and what you'd like to see me add to this newsletter.
Are you a SERIOUS trader, just a beginner, someone who is iinconsistent in trading? You NEED Sunny & Sam's tools. They promote SERIOUS trading.
If you would like to be included in Sam's totally educational "It's the Weekend!" newsletter, shoot him an email and say I sent you. It's a lot of fun.
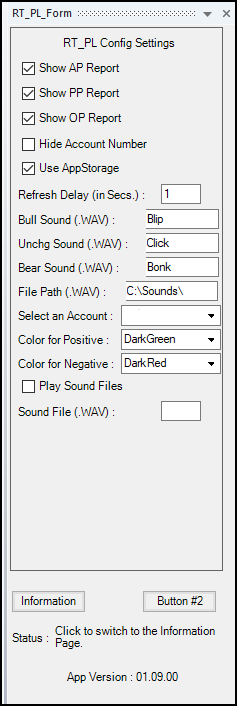
Real-Time Profit/Loss Viewer

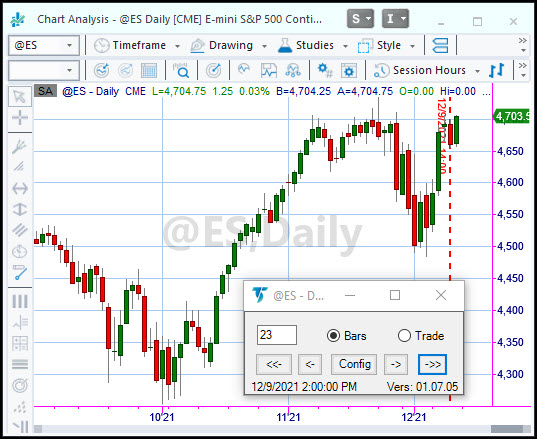
Scroll the Chart
SCROLL THE CHART DOCKED
Take a look at the bottom of the chart to see the New Docked version of this indispensable indicator.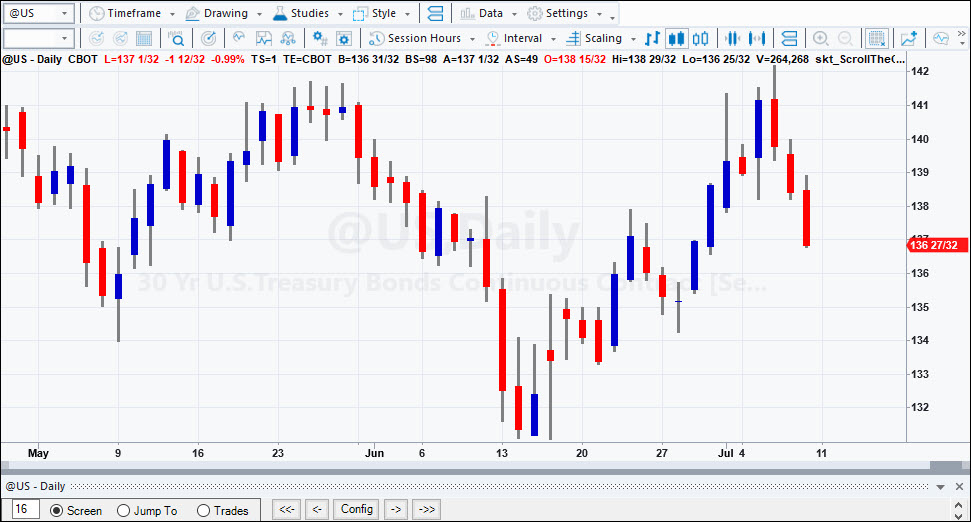
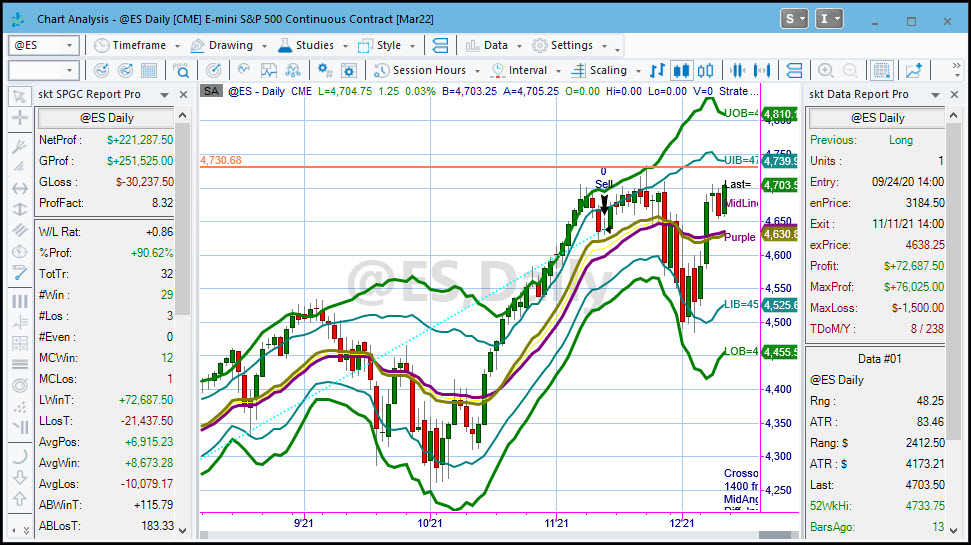
Data Report Pro & SPGC Report Pro
Archives
2024 Vol 8:
- SSS_20240714- current issue, only available by subscription
- SSS_20240714
- SSS_20240630
- SSS_20240623
- SSS_20240602
- SSS_20240526
- SSS_20240519
- SSS_20240512
- SSS_20240505
2023 Vol 7:
- SSS_20231225
- SSS_20231217
- SSS_20231210
- SSS_20231203
- SSS_20231126
- SSS_20231119
- SSS_20231112
- SSS_20231105
- SSS_20231029
- SSS_20231022
- SSS_20231015
- SSS_20231008
- SSS_20231001
- SSS_20230924
- SSS_20230917
- SSS_20230910
- SSS_20230903
- SSS_20230827
- SSS_20230820
- SSS_20230813
- SSS_20230806
- SSS_20230730
- SSS_20230723
- SSS_20230716
- SSS_20230709
- SSS_20230702
- SSS_20230618
- SSS_20230603
- SSS_20230528
- SSS_20230521
- SSS_20230514
- SSS_20230507
- SSS_20230430
- SSS_20230416
- SSS_20230409
- SSS_20230402
- SSS_20230326
- SSS 20230319
- SSS 20230312
- SSS 20230305
- SSS 20230226
- SSS 20230219
- SSS 20230212
- SSS 20230205
- SSS 20230122
- SSS 20230122
- SSS 20230115
- SSS 20230108
- SSS 20230101
2022 Vol 6:
- SSS 20221225
- SSS 20221127
- SSS 20221120
- SSS 20221113
- SSS 20221106
- SSS 20221030
- SSS 20221023
- SSS 20221016
- SSS 20221009
- SSS 20221002
- SSS 20220925
- SSS 20220918
- SSS 20220911
- SSS 20220906 - Labor Day
- SSS 20220828
- SSS 20220821
- SSS 20220814
- SSS 20220807
- SSS 20220717
- SSS 20220710
- SSS 20220703
- SSS 20220626
- SSS 20220619
- recuperating
- SSS 20220515
- SSS 20220508
- out-of-town guests
- SSS 20220424
- SSS 20220410
- SSS 20220403
- SSS 20220327
- SSS 20220313
- SSS 20220306
- SSS 20220227
- SSS 20220220
- SSS 20220213
- SSS 20220206
- SSS 20220130
- SSS 20220123
- SSS 20220116
- SSS 20220109
- SSS 20220102
2021 Vol 5:
- SSS 20211226
- SSS 20211219
- SSS 20211212
- SSS 20211205
- SSS 20211128
- SSS 20211121
- SSS_20211114
- SSS 20211107
- SSS 20211031
- SSS 20211024
- SSS 20211017
- SSS 20211010
- SSS 20211003
- SSS 20210926
- SSS 20210919
- SSS 20210912
- SSS 20210905
- SSS 20210829
- SSS 20210822
- SSS 20210815
- SSS 20210808
- SSS 20210801
- SSS 20210725
- SSS 20210718
- SSS 20210711
- SSS 20210704
- SSS 20210627
- SSS 20210620
- SSS 20210613
- SSS 20210606
- SSS 20210530
- SSS 20210523
I always welcome comments at sunny@moneymentor.com.
NOTE: I may hold some of these symbols in my own portfolio. I may be shorting others. I am not recommending you trade these. I'm just analyzing the charts. This information is for Educational Purposes Only.